

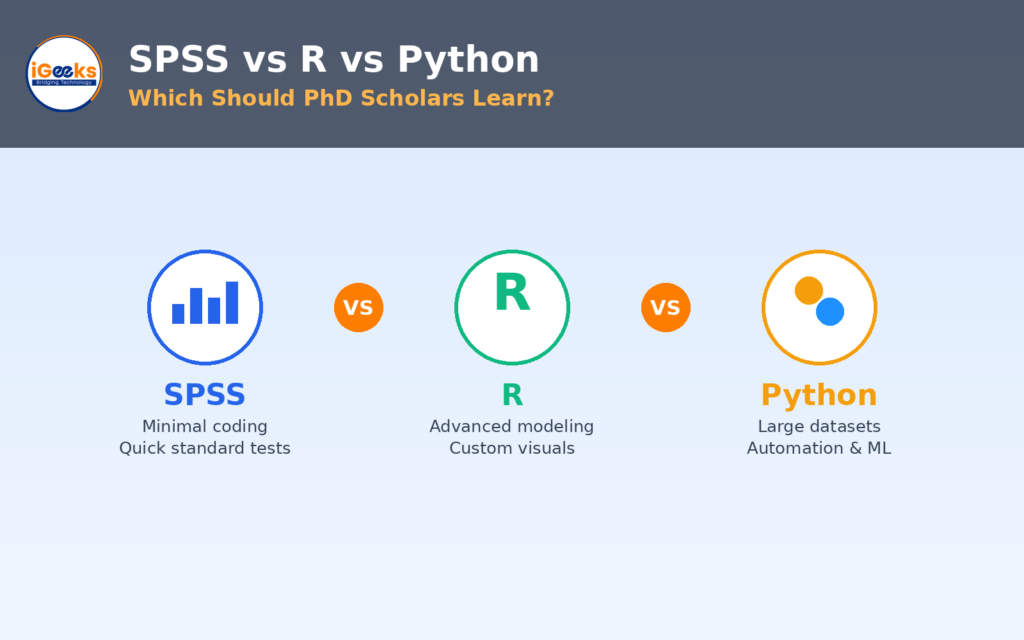
“Which software should I learn for my PhD data analysis?” is one of the most common questions research scholars ask — and one of the most poorly answered by generic advice. Most articles list every tool under the sun without addressing the real question: given your specific research design, timeline, and comfort with coding, which one is actually worth your limited time?
This isn’t another exhaustive list. It’s a decision-focused comparison to help you choose — and move on to your actual research.
The Real Question Isn’t “Which Is Best” — It’s “Which Fits My Study”
There’s no universally superior tool. SPSS, R, and Python each solve different problems well. The right choice depends on:
- What kind of data you’re working with (survey data, large datasets, text, experimental data)
- How comfortable you are — or want to become — with coding
- What your department, journal, or field typically expects
- How much time you realistically have to learn a new tool alongside your research
With that framing, here’s a direct, decision-oriented comparison.
SPSS: Best If You Want to Start Analyzing Quickly, With Minimal Coding
Choose SPSS if:
- Your research is quantitative, survey-based, or uses standard tests (t-tests, ANOVA, regression, chi-square)
- You prefer a menu-driven interface over writing code
- You’re in social sciences, education, management, or health sciences, where SPSS is widely taught and expected
- You need to get comfortable quickly, without investing weeks in learning syntax
Trade-off: SPSS becomes limiting for more advanced, custom, or highly flexible modeling — and it’s a paid license, which can matter for cost-conscious scholars or those without institutional access.
R: Best If Your Research Needs Advanced Modeling or Custom Visuals
Choose R if:
- Your research involves more advanced statistical modeling (mixed-effects models, time series, advanced regression)
- You need highly customizable, publication-quality visualizations
- Your field (epidemiology, ecology, economics, and increasingly social sciences) expects R specifically
- You’re comfortable investing some time in learning syntax in exchange for greater flexibility and it being free
Trade-off: R has a steeper initial learning curve than SPSS, and troubleshooting code errors can eat into research time if you’re new to programming.
Python: Best If You’re Working With Large, Messy, or Unconventional Data
Choose Python if:
- Your research involves large datasets, text data, or requires machine learning components
- You need to automate repetitive data cleaning or processing tasks
- Your work extends beyond traditional statistics into broader data science territory
- You want a skill that’s highly transferable outside academia as well
Trade-off: Similar learning curve to R, and for purely simple statistical testing, it can feel like more setup than necessary compared to SPSS.
What About AMOS, SmartPLS, and NVivo?
These fall outside the SPSS/R/Python comparison because they solve specific problems the big three don’t directly address:
- AMOS / SmartPLS — needed specifically for Structural Equation Modeling (testing multiple interconnected variables and theoretical frameworks), common in management and marketing research
- NVivo / ATLAS.ti — needed for qualitative research involving interview transcripts, coding, and thematic analysis — a completely different data type than SPSS, R, or Python typically handle
If your research design calls for either of these, the SPSS vs R vs Python question becomes secondary — you’ll likely need one of these specialized tools regardless.
A Simple Decision Framework
Ask yourself these three questions in order:
1. Is my data qualitative (interviews, text) or quantitative (numbers, surveys)? → Qualitative: go straight to NVivo or ATLAS.ti → Quantitative: continue to question 2
2. Am I testing a complex theoretical model with multiple interconnected variables? → Yes: consider AMOS or SmartPLS → No: continue to question 3
3. How comfortable am I with coding, and how complex is my planned analysis? → Minimal coding, standard tests: SPSS → Comfortable with code, need flexibility/advanced modeling: R → Large/messy data, automation, or machine learning: Python
This three-question filter resolves the choice for most scholars in under five minutes — far faster than an exhaustive feature-by-feature comparison.
A Word on Time Investment
A common mistake is choosing a tool based on what’s most powerful in theory, rather than what you can realistically learn and apply well within your PhD timeline. A scholar who masters SPSS’s core functions relevant to their specific tests will produce cleaner, more defensible results than one who’s still troubleshooting basic R syntax errors close to submission. Match the tool to your actual bandwidth, not just your ambitions.
You Don’t Have to Figure This Out Alone
Choosing the right tool is only the first step — running the analysis correctly and interpreting it in a way that holds up under examiner scrutiny is where many scholars want a second opinion. If you’d like guidance selecting the right approach for your specific research design, or support running and interpreting your analysis, we’re here to help.
Explore our PhD Thesis Help services in Bangalore: 👉 www.makefinalyearproject.com/phd-thesis-help-bangalore.aspx
Have a question about which tool fits your specific research? Reach out directly on WhatsApp: 📲 +91 70192 80372
The best statistical tool isn’t the most powerful one — it’s the one that gets your specific research done well.