

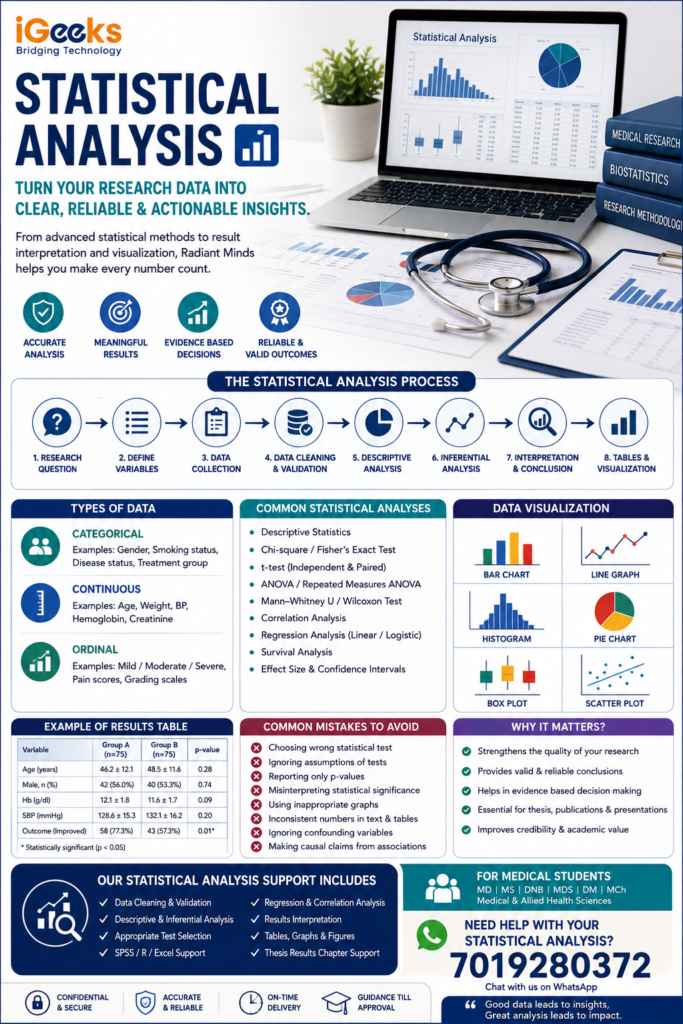
Turn your research data into clear, reliable, and actionable insights.
Statistical analysis is one of the most important stages of a medical research project. After collecting patient data, laboratory results, clinical observations, questionnaire responses, or other research measurements, the data must be analyzed using appropriate statistical methods to answer the study objectives.
For MD, MS, DNB, MDS, DM, MCh and other medical postgraduate students, choosing the correct statistical approach can make a significant difference to the quality and credibility of a thesis or research paper.
What Is Statistical Analysis in Medical Research?
Statistical analysis involves systematically organizing, summarizing and analyzing research data to identify patterns, differences, associations or relationships.
It helps researchers answer questions such as:
- Is there a significant difference between two groups?
- Is there an association between two clinical variables?
- Which factors are associated with an outcome?
- How strong is the observed relationship?
- Are the study findings statistically significant?
- How precise are the estimates?
Statistical analysis should be based on the research question, study design, type of variables and distribution of the data rather than selecting statistical tests simply because they are commonly used.
Why Is Statistical Analysis Important for Medical Students?
A medical thesis may contain a large amount of clinical or research data. Without appropriate analysis, it can be difficult to determine whether the observed findings are meaningful.
Proper statistical analysis helps students:
✅ Summarize research data clearly
✅ Compare study groups appropriately
✅ Identify statistically significant findings
✅ Quantify associations and relationships
✅ Evaluate research hypotheses
✅ Present results using tables and figures
✅ Interpret findings accurately
✅ Strengthen the scientific quality of the thesis
Statistical Analysis Process
A structured statistical workflow generally follows these stages:
Research Question
↓
Define Variables
↓
Data Collection
↓
Data Cleaning & Validation
↓
Descriptive Analysis
↓
Inferential Statistical Analysis
↓
Interpretation
↓
Tables, Graphs & Figures
↓
Research Conclusions
Each stage is important. A sophisticated statistical test cannot compensate for poorly defined variables or incorrectly collected data.
1. Understanding Your Variables
Before selecting a statistical test, it is important to understand the type of data being analyzed.
Categorical Variables
Examples include:
- Gender
- Smoking status
- Disease status
- Treatment group
- Presence or absence of a complication
Continuous Variables
Examples include:
- Age
- Weight
- Blood pressure
- Hemoglobin level
- Serum creatinine
- Hospital stay duration
Ordinal Variables
Examples include:
- Mild / moderate / severe
- Pain scores
- Disease severity categories
- Grading scales
Correctly identifying the variables is an essential first step in statistical analysis.
2. Descriptive Statistics
Descriptive statistics summarize the characteristics of the study population.
Depending on the data, researchers may report:
- Mean
- Median
- Standard deviation
- Interquartile range
- Minimum and maximum
- Frequency
- Percentage
Example
Suppose a study includes 150 participants.
A descriptive analysis might report:
Mean age: 48.6 years
Male participants: 82 (54.7%)
Female participants: 68 (45.3%)
These statistics provide a basic understanding of the study population before conducting further analysis.
3. Inferential Statistics
Inferential statistics help researchers draw conclusions about relationships or differences observed in their data.
Depending on the study design and data characteristics, analyses may include:
- Chi-square test
- Fisher’s exact test
- Independent t-test
- Paired t-test
- Mann–Whitney U test
- Wilcoxon signed-rank test
- ANOVA
- Kruskal–Wallis test
- Correlation analysis
- Linear regression
- Logistic regression
- Survival analysis
The appropriate test depends on factors such as variable type, distribution, number of groups, independence of observations and study design.
4. Hypothesis Testing
Many medical research studies involve testing a predefined hypothesis.
For example:
Research question: Does treatment A produce a different clinical outcome compared with treatment B?
Statistical testing can help determine whether the observed difference is compatible with the null hypothesis under the chosen analytical framework.
However, statistical significance should not be interpreted as clinical importance by itself.
A result may be statistically significant but have limited clinical relevance. Therefore, researchers should consider the effect size, confidence interval and clinical context along with the p-value.
5. P-Value and Confidence Intervals
Medical students often encounter the terms p-value and confidence interval in research papers and thesis results.
P-Value
A p-value is used within a specified statistical hypothesis-testing framework to quantify how incompatible the observed data are with the null hypothesis.
It should not be interpreted as the probability that the null hypothesis is true.
Confidence Interval
A confidence interval provides a range of plausible values for a population parameter under the statistical procedure used.
Reporting confidence intervals can provide useful information about the precision and magnitude of an estimated effect.
6. Correlation and Regression Analysis
Sometimes researchers want to determine whether two variables are related.
For example:
- Age and blood pressure
- BMI and glucose levels
- Disease duration and clinical score
Correlation analysis can quantify the strength and direction of an association.
Regression Analysis
Regression models can be used when researchers want to examine associations between an outcome and one or more explanatory variables.
Depending on the outcome, researchers may use:
- Linear regression
- Logistic regression
- Cox proportional hazards regression
- Other generalized regression models
Regression analysis can also help account for potential confounding variables when appropriately designed and interpreted.
7. Data Visualization
Good visualization can make complex research findings easier to understand.
Common options include:
📊 Bar charts
📈 Line graphs
📉 Histograms
🔵 Scatter plots
📦 Box plots
📋 Tables
🌳 Forest plots
⏱️ Kaplan–Meier curves
The visualization should match the type of data and research question. A graph should clarify the result rather than simply decorate the thesis.
8. Statistical Tables for a Medical Thesis
Well-designed tables are essential for presenting results.
A thesis may include tables showing:
Table 1
Baseline demographic and clinical characteristics.
Table 2
Comparison of important variables between study groups.
Table 3
Primary and secondary outcomes.
Table 4
Association between relevant variables.
Table 5
Regression or multivariable analysis, where applicable.
Tables should have clear titles, properly defined abbreviations and appropriate statistical measures.
9. Statistical Software
Medical researchers may use different statistical software depending on the complexity of the study and institutional requirements.
Commonly used tools include:
- SPSS
- R
- Stata
- SAS
- Python
- GraphPad Prism
- MedCalc
The software itself does not determine whether an analysis is correct. The statistical method, assumptions, data quality and interpretation are more important than the software used.
10. Statistical Analysis for Different Medical Studies
Different research designs require different analytical approaches.
Cross-Sectional Studies
May involve:
- Descriptive statistics
- Prevalence estimates
- Tests of association
- Regression analysis
Case-Control Studies
May involve:
- Odds ratios
- Confidence intervals
- Chi-square/Fisher’s exact tests
- Logistic regression
Cohort Studies
May involve:
- Risk estimates
- Relative risk
- Survival analysis
- Regression models
Clinical Trials
May involve:
- Between-group comparisons
- Within-group analysis
- Effect estimates
- Confidence intervals
- Intention-to-treat analysis where appropriate
The analysis plan should be developed according to the protocol and study objectives.
Common Statistical Mistakes in Medical Theses
Medical students should be careful to avoid:
❌ Choosing statistical tests without understanding the data
❌ Using inappropriate tests for the variable type
❌ Ignoring assumptions of statistical methods
❌ Reporting only p-values
❌ Misinterpreting statistical significance
❌ Performing multiple analyses without an appropriate plan
❌ Using inappropriate graphs
❌ Inconsistent numbers between text and tables
❌ Failing to account for important confounders
❌ Making causal claims from observational associations
A statistical analysis plan should ideally be considered before data collection, particularly for prospective studies.
How Statistical Analysis Support Can Help
Academic statistical support can assist medical students in organizing and analyzing research data appropriately.
Support may include:
📌 Data Cleaning
Checking missing values, inconsistencies, coding and data quality.
📌 Descriptive Analysis
Summarizing demographic and clinical characteristics.
📌 Statistical Test Selection
Identifying appropriate methods based on the research question and data characteristics.
📌 Comparative Analysis
Analyzing differences between relevant study groups.
📌 Association & Regression Analysis
Evaluating relationships between variables and potential predictors.
📌 Tables & Graphs
Preparing publication-ready statistical tables and appropriate visualizations.
📌 Results Interpretation
Explaining statistical findings in clear academic language without overstating conclusions.
📌 Thesis Results Chapter
Helping organize statistical findings into a structured results section.
Statistical Analysis Support for Medical Students
We provide academic research support for:
MD | MS | DNB | MDS | DM | MCh | Medical & Allied Health Sciences
Support can include:
Data Analysis • Statistical Test Selection • SPSS Support • Results Interpretation • Tables & Graphs • Thesis Results Chapter • Research Paper Analysis
📲 For enquiries: WhatsApp 7019280372
Final Takeaway
Statistical analysis is not simply about generating p-values. It is about matching the research question with appropriate methods, analyzing the data correctly and communicating the findings accurately.
A well-planned statistical analysis can transform raw research data into meaningful evidence and help medical students present their thesis findings with greater clarity, transparency and scientific rigor.