

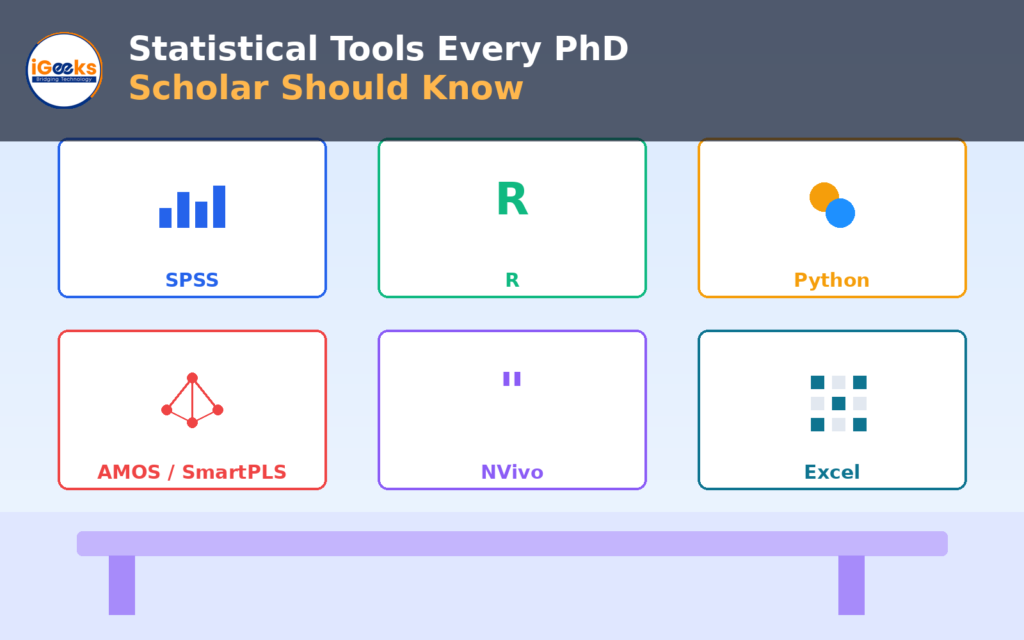
Data analysis is one of the stages where PhD scholars most often feel out of their depth — not because the research is flawed, but because choosing and using the right statistical tool is a skill most academic training only briefly touches on. Whether your research is quantitative, qualitative, or mixed methods, knowing which tool fits your data — and what it’s actually good for — can save you weeks of trial and error.
Here’s a practical overview of the statistical and analysis tools most commonly used across PhD research.
1. SPSS (Statistical Package for the Social Sciences)
Best for: Quantitative research in social sciences, management, education, health sciences, and business studies.
SPSS remains one of the most widely used tools for PhD-level quantitative analysis because of its accessible interface — most functions can be run through menus rather than code. It’s commonly used for:
- Descriptive statistics (means, frequencies, standard deviations)
- Inferential tests (t-tests, ANOVA, chi-square)
- Regression analysis
- Reliability testing (Cronbach’s Alpha)
- Factor analysis
Why scholars choose it: Minimal coding required, widely taught, and well-documented — making it a common starting point for scholars without a programming background.
2. R
Best for: Advanced statistical analysis, custom visualizations, and scholars comfortable with (or willing to learn) coding.
R is a free, open-source programming language built specifically for statistics. It’s especially popular in fields like epidemiology, ecology, economics, and increasingly across social sciences for more advanced modeling. Common uses include:
- Complex statistical modeling (mixed-effects models, time series analysis)
- Custom, publication-quality data visualizations (via packages like ggplot2)
- Reproducible research through scripts, rather than manual point-and-click steps
Why scholars choose it: Free, highly flexible, and increasingly expected in fields where advanced modeling or reproducibility is valued by journals.
3. Python (with libraries like pandas, NumPy, SciPy)
Best for: Data-heavy research, machine learning applications, and scholars working with large or unstructured datasets.
Python has become increasingly common in PhD research involving large datasets, text data, or predictive modeling. Typical applications include:
- Data cleaning and manipulation (pandas)
- Statistical testing (SciPy, statsmodels)
- Machine learning applications (scikit-learn), where relevant to the research
- Automating repetitive data processing tasks
Why scholars choose it: Extremely versatile, strong community support, and useful beyond just statistics — especially valuable if your research involves large-scale or unconventional data sources.
4. AMOS / SmartPLS (Structural Equation Modeling)
Best for: Research involving complex relationships between multiple variables — common in management, marketing, organizational behavior, and social sciences.
Structural Equation Modeling (SEM) tools like AMOS and SmartPLS are used when a study involves testing multiple interconnected hypotheses simultaneously, such as mediating or moderating variables. Typical uses include:
- Testing theoretical models with multiple latent variables
- Confirmatory factor analysis
- Path analysis showing direct and indirect relationships
Why scholars choose it: Essential for research designs built around complex theoretical frameworks that simple regression can’t adequately capture.
5. NVivo / ATLAS.ti (Qualitative Data Analysis)
Best for: Qualitative or mixed-methods research involving interviews, focus groups, or textual data.
These tools help organize and analyze non-numerical data systematically. Common applications include:
- Coding interview transcripts by theme
- Identifying patterns across large volumes of qualitative data
- Managing and cross-referencing multiple data sources (documents, audio, video)
Why scholars choose it: Manual qualitative coding becomes unmanageable at scale — these tools bring structure and traceability to otherwise unwieldy datasets.
6. Excel
Best for: Basic data organization, simple statistical summaries, and preliminary data cleaning before deeper analysis.
Excel is often underestimated, but it remains genuinely useful for:
- Initial data cleaning and organization
- Basic descriptive statistics and simple charts
- Preparing data for import into more advanced tools like SPSS or R
Why scholars choose it: Nearly universal familiarity and a practical first step before moving into specialized software.
How to Choose the Right Tool for Your Research
Rather than starting with “which tool should I learn,” start with your research design:
- Simple quantitative analysis (surveys, basic comparisons) → SPSS or Excel
- Complex statistical modeling or large datasets → R or Python
- Testing theoretical frameworks with multiple variables → AMOS or SmartPLS
- Interview or text-based qualitative research → NVivo or ATLAS.ti
- Mixed methods → A combination, often SPSS/R alongside NVivo
You don’t need to master every tool — you need to competently use the one or two that fit your specific research design and questions.
Common Mistakes Scholars Make With Statistical Tools
- Choosing a tool based on popularity, not fit — a tool your peers use isn’t necessarily right for your data
- Learning the software before finalizing the research design — this can lead to reshaping research questions around software limitations rather than the reverse
- Running tests without understanding assumptions — many statistical tests have prerequisites (normality, sample size, independence) that are often overlooked
- Treating software output as automatically correct — results still need to be interpreted correctly in context
A Practical Approach for Scholars New to Statistical Analysis
- Finalize your research questions and hypotheses first
- Identify the specific statistical tests those questions require
- Choose the simplest tool capable of running those tests well
- Learn only the specific functions you need, rather than the entire software
- Validate your results with a second review before finalizing
Get Expert Help With Your Data Analysis
Choosing the right statistical approach — and running it correctly — can be one of the most technically demanding parts of a PhD. If you’d like guidance on selecting the right tool, running your analysis, or interpreting your results for your thesis, we’re here to help.
Explore our PhD Thesis Help services in Bangalore: 👉 www.makefinalyearproject.com/phd-thesis-help-bangalore.aspx
Have a question? Reach out directly on WhatsApp: 📲 +91 70192 80372
The right tool, used correctly, can turn your data into a thesis chapter you’re confident defending.