

Introduction
Data analysis is one of the most critical stages of any PhD research project. Regardless of your research domain—Management, Healthcare, Nursing, Pharmacy, Engineering, Education, Psychology, or Social Sciences—your research findings are only as strong as your data analysis.
Among the various statistical software packages available, IBM SPSS Statistics remains one of the most widely used tools for academic research due to its user-friendly interface, powerful statistical capabilities, and acceptance by universities worldwide.
This beginner’s guide explains how to use SPSS for PhD thesis data analysis in 2026, covering everything from data entry to hypothesis testing and interpretation.
What is SPSS?
SPSS stands for Statistical Package for the Social Sciences.
Originally developed for social science research, SPSS is now widely used across various disciplines:
- Management Studies
- Medical Research
- Nursing Research
- Pharmacy Research
- Psychology
- Education
- Public Health
- Social Sciences
- Marketing Research
- Economics
SPSS enables researchers to:
✔ Manage large datasets
✔ Perform statistical analysis
✔ Generate graphs and charts
✔ Test hypotheses
✔ Produce publication-ready outputs
Why PhD Students Use SPSS
Key Benefits
User-Friendly Interface
SPSS provides a point-and-click environment requiring minimal programming knowledge.
Fast Analysis
Complex statistical calculations can be completed within minutes.
Academic Acceptance
Most universities accept SPSS-generated outputs for thesis submissions.
Reliable Results
SPSS is widely trusted by researchers and journal publishers.
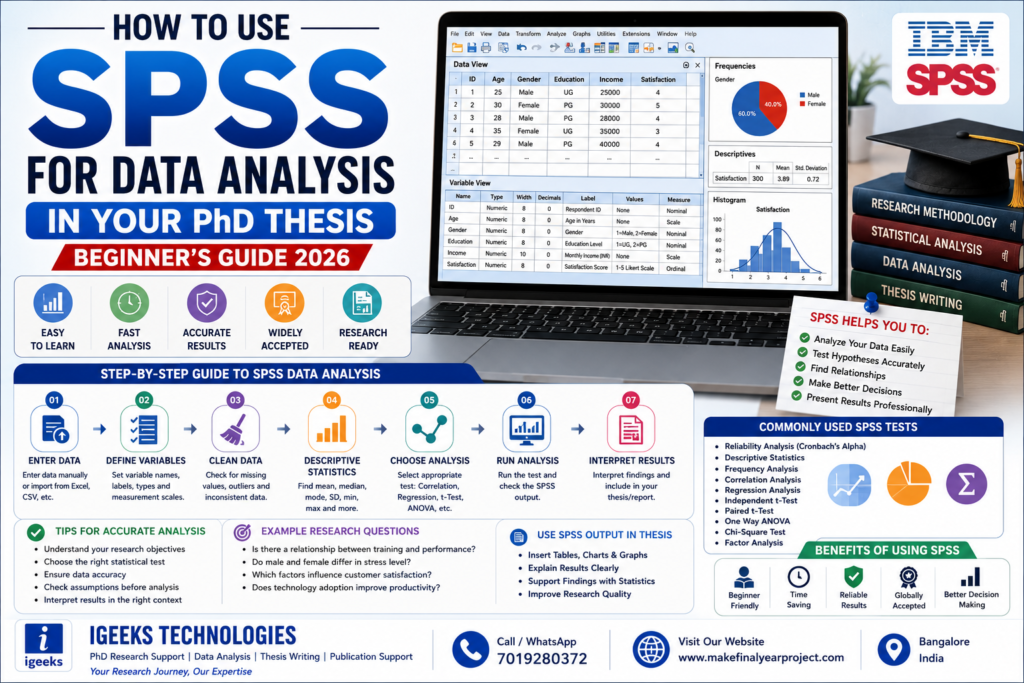
Understanding the SPSS Interface
When you open SPSS, you will see two primary tabs:
1. Data View
Data View resembles an Excel spreadsheet.
Each row represents:
- One respondent
- One patient
- One observation
Each column represents:
- Variables
- Questions
- Measurements
Example:
| Respondent | Age | Gender | Satisfaction |
|---|---|---|---|
| 1 | 25 | Male | 4 |
| 2 | 30 | Female | 5 |
2. Variable View
Variable View defines:
- Variable names
- Labels
- Data types
- Measurement scales
Example:
| Variable Name | Label |
| Age | Respondent Age |
| Gender | Participant Gender |
| Sat | Satisfaction Score |
Step 1: Enter Data into SPSS
Manual Data Entry
Researchers can manually enter questionnaire responses.
Import Data
SPSS supports importing data from:
- Microsoft Excel
- CSV Files
- Database Systems
Common Data Types
- Numeric
- String
- Date
- Currency
Step 2: Define Variables Correctly
Before analysis, define variables properly.
Example:
Gender
1 = Male
2 = Female
Satisfaction
1 = Strongly Disagree
2 = Disagree
3 = Neutral
4 = Agree
5 = Strongly Agree
Proper coding improves analysis accuracy.
Step 3: Clean Your Data
Data cleaning is essential before analysis.
Check for
- Missing values
- Duplicate entries
- Incorrect coding
- Outliers
- Invalid responses
Example
Age = 250
Clearly invalid and requires correction.
Step 4: Descriptive Statistics
Descriptive statistics summarize data.
Common Measures
- Mean
- Median
- Mode
- Standard Deviation
- Minimum
- Maximum
Example
Average Age = 32.5 Years
Standard Deviation = 5.8
This provides an overview of the dataset.
Step 5: Frequency Analysis
Frequency analysis shows response distribution.
Example:
Gender Distribution
Male = 120
Female = 180
Total = 300
Useful for demographic profiling.
Step 6: Reliability Analysis (Cronbach’s Alpha)
Reliability testing checks questionnaire consistency.
Common Standard
Cronbach’s Alpha > 0.70
Interpretation:
- Above 0.90 = Excellent
- 0.80–0.89 = Good
- 0.70–0.79 = Acceptable
- Below 0.70 = Needs Improvement
Most PhD studies perform reliability testing before hypothesis testing.
Step 7: Correlation Analysis
Correlation measures relationships between variables.
Example
Relationship between:
- Customer Satisfaction
- Customer Loyalty
Correlation Coefficient (r)
Range:
-1 to +1
Interpretation:
+0.85 = Strong Positive Relationship
0 = No Relationship
-0.75 = Strong Negative Relationship
Step 8: Regression Analysis
Regression identifies the impact of independent variables on dependent variables.
Example
Dependent Variable:
- Customer Loyalty
Independent Variables:
- Service Quality
- Product Quality
- Brand Trust
Regression helps determine which factor has the strongest influence.
Step 9: T-Test Analysis
T-tests compare means between groups.
Example
Research Question:
Do male and female students differ in academic performance?
SPSS calculates whether differences are statistically significant.
Step 10: ANOVA Analysis
ANOVA compares means among three or more groups.
Example
Compare satisfaction levels among:
- Undergraduate Students
- Postgraduate Students
- PhD Scholars
ANOVA determines whether significant differences exist.
Step 11: Chi-Square Test
Used for categorical variables.
Example
Relationship between:
- Gender
- Product Preference
SPSS identifies whether the variables are associated.
Step 12: Factor Analysis
Factor Analysis identifies underlying dimensions within datasets.
Applications
- Questionnaire Development
- Scale Validation
- Construct Measurement
Widely used in:
- MBA Research
- PhD Management Studies
- Psychology Research
Step 13: Generate Graphs and Charts
SPSS can create:
Charts
- Bar Charts
- Pie Charts
- Histograms
- Scatter Plots
- Line Charts
These improve thesis presentation and interpretation.
Step 14: Interpret Results
Analysis alone is insufficient.
Researchers must explain:
Example
Finding:
Correlation = 0.78
Interpretation:
Customer satisfaction has a strong positive relationship with customer loyalty.
Always convert statistical outputs into meaningful research insights.
Common SPSS Tests Used in PhD Research
| Analysis Type | Purpose |
| Descriptive Statistics | Data Summary |
| Frequency Analysis | Distribution Analysis |
| Reliability Test | Questionnaire Validation |
| Correlation | Relationship Analysis |
| Regression | Prediction Analysis |
| T-Test | Compare Two Groups |
| ANOVA | Compare Multiple Groups |
| Chi-Square | Categorical Relationships |
| Factor Analysis | Dimension Reduction |
SPSS Output Reporting Example
Correlation Analysis
The Pearson correlation coefficient between customer satisfaction and loyalty was 0.782 (p < 0.001), indicating a strong positive relationship between the variables.
This format is commonly used in:
- PhD Theses
- Journal Papers
- Conference Publications
Common Mistakes PhD Students Make in SPSS
❌ Entering data incorrectly
❌ Using inappropriate statistical tests
❌ Ignoring missing values
❌ Misinterpreting p-values
❌ Reporting outputs without explanation
❌ Conducting analysis without reliability testing
SPSS vs Other Statistical Software
| Software | Best For |
| SPSS | Beginner-Friendly Research Analysis |
| R Programming | Advanced Statistical Analysis |
| Python | Machine Learning & Data Science |
| STATA | Economics Research |
| SAS | Large Enterprise Analytics |
| MATLAB | Engineering Research |
SPSS remains one of the easiest statistical tools for beginners.
SPSS Data Analysis Support for PhD Scholars
Many researchers seek expert assistance for:
- Questionnaire Design
- Data Collection Support
- SPSS Analysis
- Reliability Testing
- Hypothesis Testing
- Interpretation of Results
- Thesis Chapter 4 Writing
- Research Paper Writing
- Journal Publication Support
For professional PhD research and SPSS data analysis assistance, visit:
https://www.makefinalyearproject.com/phd-thesis-help-bangalore.aspx
Igeeks provides research support services across Management, Engineering, Medical Sciences, Nursing, Pharmacy, Education, and Social Science disciplines.
Frequently Asked Questions (FAQs)
1. Is SPSS difficult to learn?
No. SPSS is considered one of the easiest statistical software packages for beginners.
2. Which SPSS tests are commonly used in PhD research?
Descriptive Statistics, Reliability Analysis, Correlation, Regression, T-Test, ANOVA, and Chi-Square tests are among the most frequently used.
3. Can SPSS analyze questionnaire data?
Yes. SPSS is widely used for survey and questionnaire-based research.
4. What is Cronbach’s Alpha?
Cronbach’s Alpha measures questionnaire reliability and internal consistency.
5. What is a good Cronbach’s Alpha value?
Values above 0.70 are generally considered acceptable.
6. Can SPSS generate graphs?
Yes. SPSS creates professional charts and visualizations for research reports.
7. Is SPSS suitable for medical research?
Yes. SPSS is extensively used in medical, nursing, and public health research.
8. How many samples are required for SPSS analysis?
Sample size depends on the research design, objectives, and statistical methods used.
9. Can SPSS help publish journal papers?
SPSS provides statistical analysis and outputs that are commonly used in journal manuscripts.
10. Should I learn SPSS or Python for PhD research?
For traditional academic statistical analysis, SPSS is often easier for beginners. Python is more suitable for advanced analytics, AI, and machine learning projects.
Conclusion
SPSS remains one of the most trusted and widely used statistical tools for PhD research in 2026. From descriptive statistics and reliability testing to regression analysis and hypothesis testing, SPSS enables researchers to analyze data efficiently and present findings professionally. By mastering SPSS, PhD scholars can strengthen the quality of their thesis, improve publication opportunities, and make evidence-based research contributions.